Bankability, Capital & Risk
National Mandates, Global SAF Value Chains
A decision framework for SAF producers evaluating global mandates, market eligibility, pathway economics, siting, integration and project financeability.
August 6, 2026 · 20 min read · Elvis Ebikade
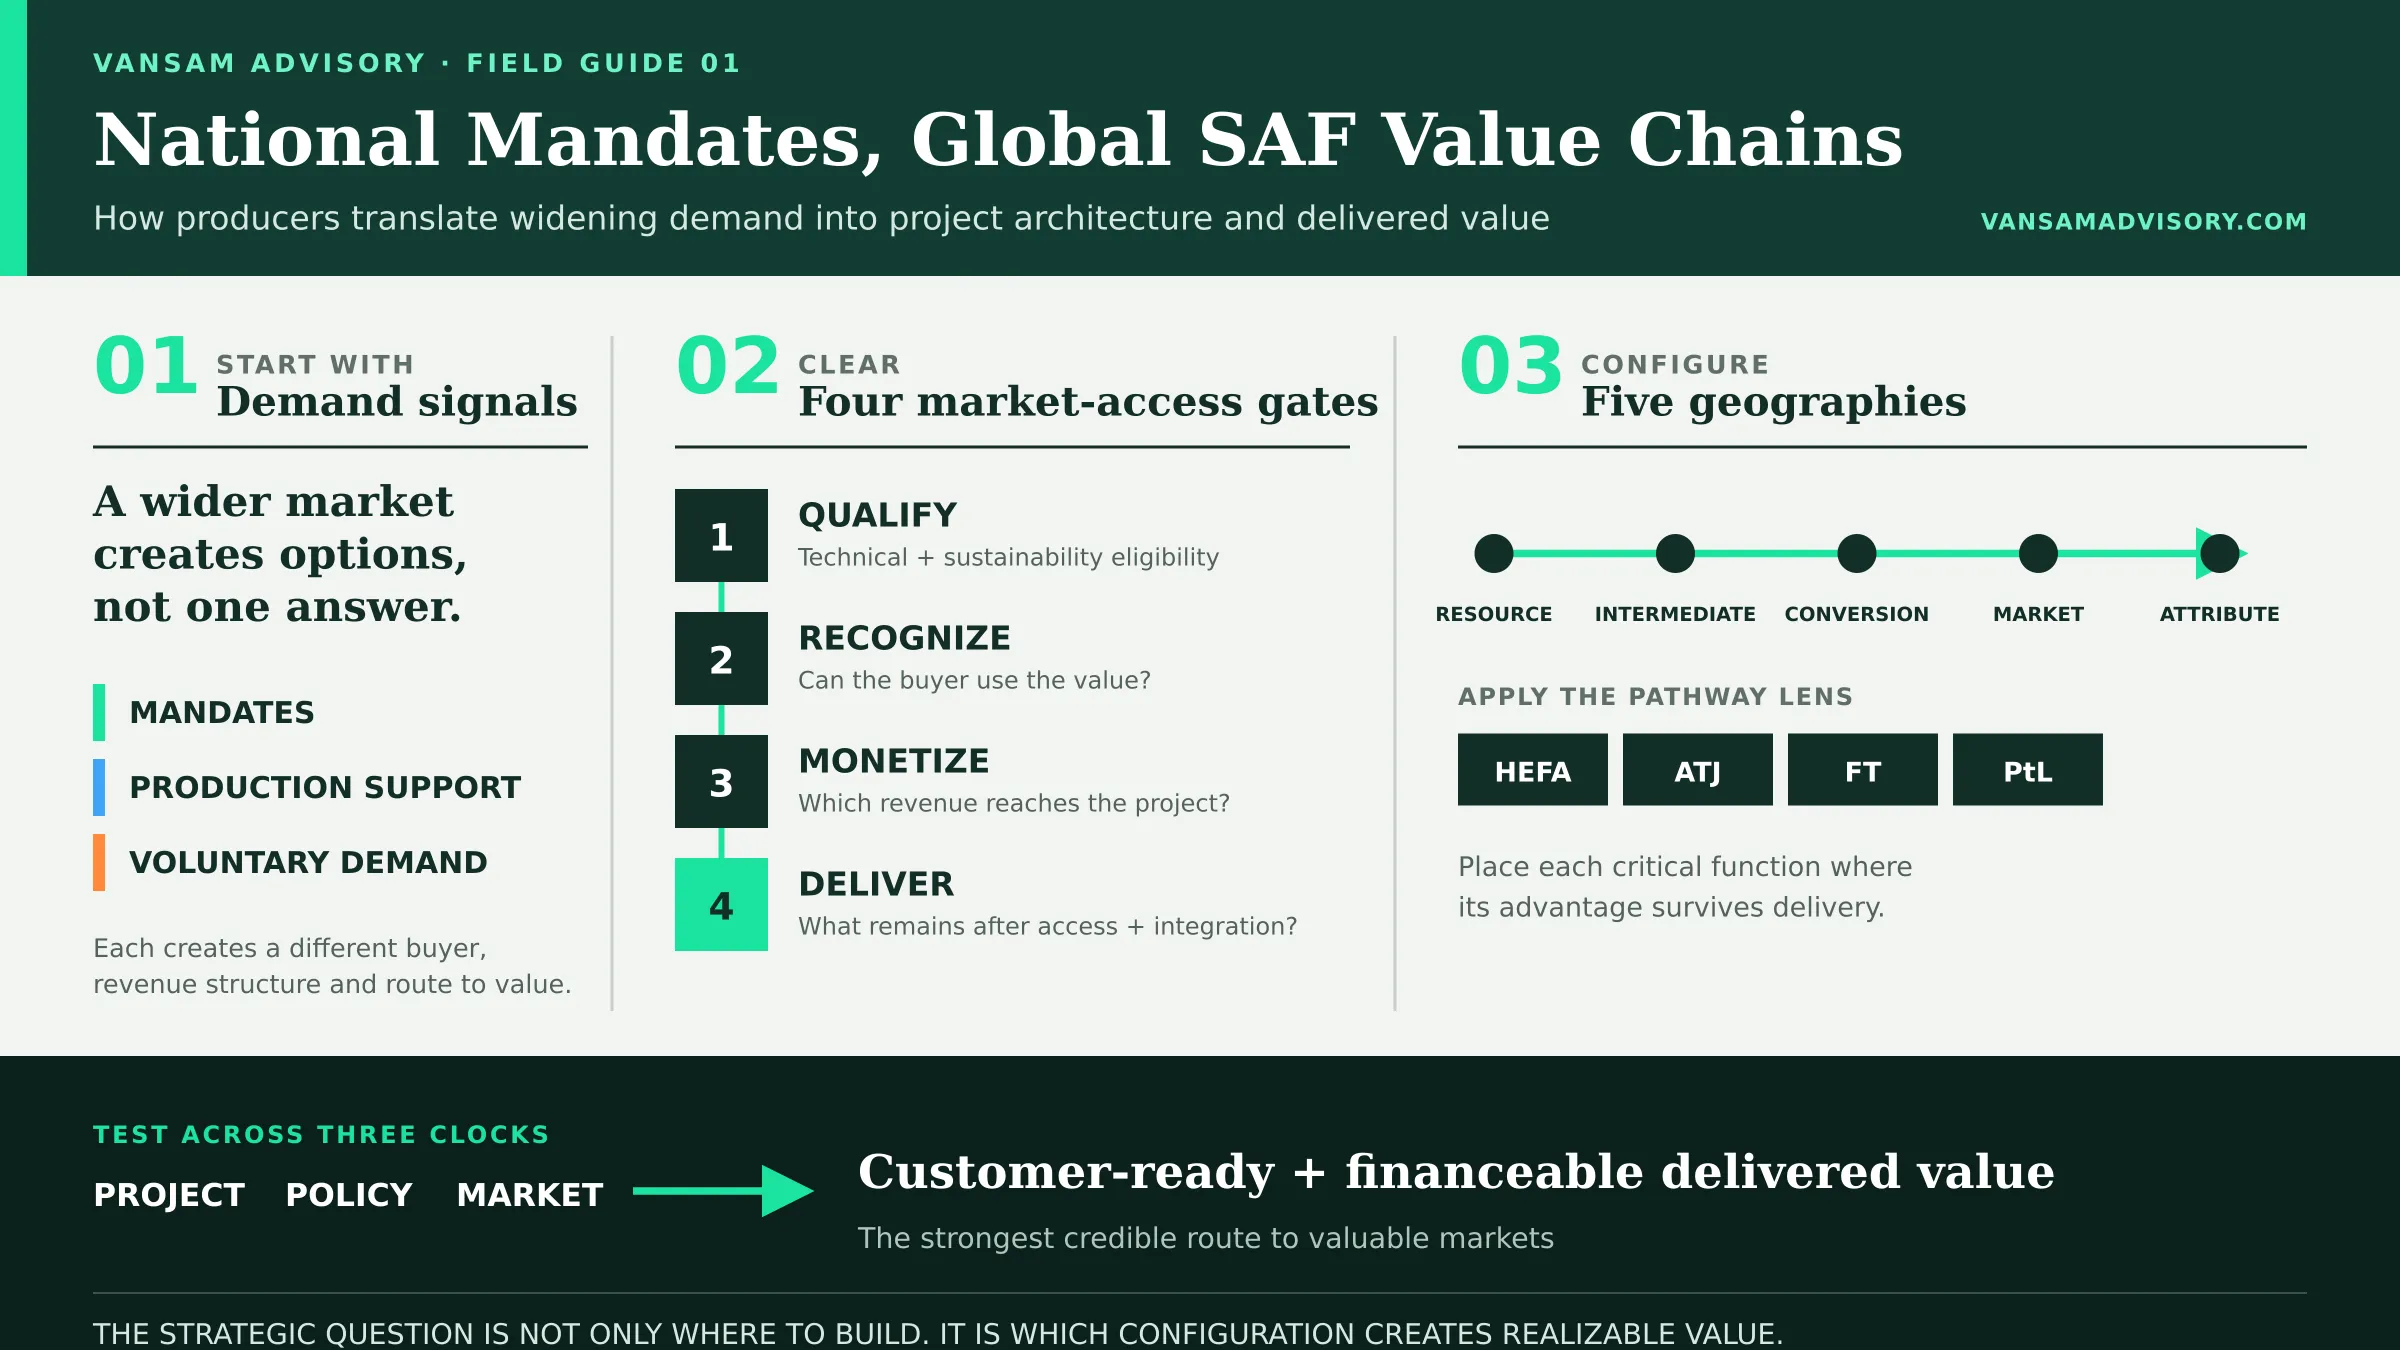
sustainable aviation fuel, which gives producers more routes to market and changes the project-development question. However, the question is no longer simply where to locate a plant that serves a local mandate. It is which combination of resources, production steps, sustainability qualification and market access gives a project the strongest delivered economics, while preserving only the options that justify their cost. That distinction matters because conventional fuel value chains are already global, while SAF carries an additional commercial layer. Its value depends on the physical fuel, the lifecycle emissions, the sustainability framework under which those emissions are recognized, the ownership of the environmental attributes and the policy mechanism supporting the buyer. A technically qualified fuel can therefore have materially different value across two markets, even when the molecule is the same. For producers and project developers, capturing this opportunity requires the market strategy, project architecture and capital plan to develop together. The decision for developersDetermine which markets the project can credibly access, where each critical production and integration step creates the most advantage, and which assumptions must be proven before the next capital commitment. Demand is widening, although the commercial structures differ The EU and UK operate binding supplier mandates. Beyond them, the market structures differ: Australia is building a production-led investment platform; Brazil places an emissions-reduction obligation on airlines; Canada combines an aspirational federal goal with binding provincial measures; Japan has established a supplier-side 2030 target; Singapore is creating a centralized procurement mechanism funded through a passenger levy; South Korea has published a staged blending roadmap; and the United States primarily supports production through incentives rather than a federal mandate. These mechanisms create different buyers, revenue structures and qualification requirements. The headline percentage establishes the size of the signal, while the underlying rules determine whether a producer can monetize it. #block-e1512bee48854be9ff0f { } #block-e1512bee48854be9ff0f .sqs-html-content { } #block-e1512bee48854be9ff0f { mix-blend-mode: var(--tweak-text-block-blend ); border-radius: var(--tweak-text-block-radius); } @media screen and (max-width: 767px) { #block-e1512bee48854be9ff0f { } } @media screen and (max-width: 767px) { #block-e1512bee48854be9ff0f .sqs-html-content { } } @media screen and (max-width: 767px) { } Framework connecting SAF demand signals, four market-access gates and five project geographies to customer-ready, financeable delivered value." data-lightbox-theme="dark" > View fullsize Framework connecting SAF demand signals, four market-access gates and five project geographies to customer-ready, financeable delivered value. Market-by-market decision guideEuropean Union
Demand: Binding supplier mandate, from 2% in 2025 to 6% in 2030 and 70% in 2050; the synthetic-fuel sub-mandate begins in 2030.
Imported supply: Permitted when the fuel satisfies RED sustainability, GHG and traceability requirements.
Production support: EU instruments apply their own location and eligibility conditions.
Decision: Test feedstock, electricity, carbon source and chain of custody before assigning EU compliance value. United Kingdom
Demand: Binding supplier mandate, from 2% in 2025 to 10% in 2030 and 22% in 2040; HEFA cap and PtL obligation.
Imported supply: Permitted when mandate sustainability, GHG and administrative requirements are met.
Production support: The July 2026 RCM allocation strategy is directed to qualifying UK production and excludes HEFA; the first competition has not yet launched.
Decision: Price mandate access and production support as separate revenue cases. Australia
Demand: Production-led federal strategy without a binding national SAF mandate.
Imported supply: Imports remain available within the current fuel market.
Production support: Approximately A$1.4 billion committed to the low-carbon liquid-fuel supply chain, including the A$1.1 billion Cleaner Fuels Program; ARENA and state programs support project development.
Decision: Treat Australia as a production and capital-location opportunity while contracting demand separately. Brazil
Demand: Binding emissions-reduction obligation for domestic flights, from 1% in 2027 to 10% in 2037.
Imported supply: The proposed certificate architecture includes importers, while final implementation remains material to practical access.
Production support: Domestic financing supports Brazilian projects.
Decision: Compare domestic compliance and export value on lifecycle performance rather than volume alone. Canada
Demand: The federal 10% goal remains aspirational; British Columbia has binding carbon-intensity and renewable-content requirements.
Imported supply: The federal Blueprint expressly anticipates imports alongside domestic production.
Production support: Domestic measures remain distinct from market access.
Decision: Treat Canada as an emerging import option while underwriting only enacted demand. Japan
Demand: Supplier-side 2030 target equivalent to approximately 10% SAF use.
Imported supply: Market access is open to imported supply.
Production support: Production support favors domestic capacity.
Decision: Separate access to demand from access to Japanese production support. Singapore
Demand: Levy-funded centralized procurement, with the 1% target beginning in 2027.
Imported supply: Import supply is integral to the model.
Production support: No general local-production condition for market access.
Decision: Evaluate centralized procurement, logistics and hub integration together. South Korea
Demand: The roadmap targets 1% from 2027, with later ranges and implementing details to be fixed through staged reviews.
Imported supply: Imports are expected to be important given limited domestic supply.
Production support: Domestic production policy is developing in parallel.
Decision: Treat the roadmap as a demand signal and update the revenue case as enforceable ratios and rules are fixed. United States
Demand: Production-side incentives, including 45Z, with no federal SAF mandate.
Imported supply: Primarily a production and export question.
Production support: Support is tied to US production and, from 2026, qualifying North American feedstock.
Decision: Compare domestic realization with export value after incentives, logistics and attribute treatment. Three implications shape project decisions. Market access and production support are separate value streams. Imported SAF can serve the UK mandate when it qualifies, while the Revenue Certainty Mechanism is directed to eligible production in the UK. The EU similarly creates demand that imported RED-compliant fuel can serve, while its supply-side instruments apply their own eligibility and location conditions. The Commission's 17 July 2026 EU ETS revision proposal would sharpen that distinction by extending the aviation fuel-support mechanism through 2040. Member States would allocate allowances annually to eligible aircraft operators using qualifying fuels; for renewable hydrogen and drop-in RFNBO aviation fuel, the allowance value would cover 60% under the proposed revision, down from 95% today, of the remaining price differential with fossil kerosene after carbon-price incentives and harmonized minimum taxation are taken into account. The airline would receive the tradable allowances, so the producer would participate only where the offtake defines how that value reduces the buyer's effective cost or supports the fuel price. The proposal would also allow an aircraft operator with a binding fuel-supply contract of at least three years to reserve support for up to five years. An ETS-ready commercial structure would therefore need to identify the eligible airline, preserve the records required for its claim and establish how the value is shared among the producer, fuel supplier and aircraft operator. The proposal would not close the full eSAF premium, and its production-location conditions may exclude fuel that otherwise qualifies for ReFuelEU demand. Until the legislation is enacted, this value belongs in a structured upside case rather than base project revenue. Australia illustrates the reverse configuration. It has no binding federal SAF mandate, while the Australian Government has committed approximately A$1.4 billion to the low-carbon liquid-fuel supply chain, including A$1.1 billion for the Cleaner Fuels Program. In July 2026, ARENA announced up to A$32 million in staged development funding for HAMR Energy's forestry-residue, renewable-methanol and methanol-to-jet value chain across Victoria and South Australia. For a developer, Australia may offer resource, intermediate-production and project-support advantages, while dependable demand still needs to be contracted.
- The basis of compliance changes the value of carbon intensity. Brazil's ProBioQAV obligation is expressed as an emissions reduction rather than a fixed SAF volume, which can give lower-carbon fuel more compliance value per unit. The proposed CS-SAF certificate framework includes producers, importers and blending agents, although final implementation will determine practical access. Under the draft, imported SAF would require certification through an ICAO-approved sustainability certification scheme, while domestic SAF could also use the national program to be administered by ANP. Brazil should therefore be assessed as both a demand market and a production platform, while the import case remains tied to the final rules.
- Trade policy can change the preferred configuration even when the technology does not change. The additional 25% US tariff on specified Brazilian goods, including ethanol, took effect in July 2026, while Brazil continues to apply its own tariff to US ethanol. For an ATJ developer, the relevant question is whether alcohol should be moved or converted at origin, and the answer must be based on the lawful delivered value of each configuration under the applicable customs treatment.
The same geographic decision appears differently across development stages. A novel technology company may need to show that its next demonstration supports scale-up, fuel qualification and a credible target market. A project using established process packages may be preparing for FEL, FEED or Final Investment Decision, where the burden shifts toward feedstock, site conditions, integration, cost, schedule, offtake and compliance value. Some PtL projects carry both tracks because a proprietary hydrogen or carbon-conversion platform feeds established synthesis or upgrading equipment.
At each stage, the practical question is the same: which market and value-chain assumptions must be demonstrated before the next capital decision? The companion Vansam insight, The Least-Mature Evidence Sets the Pace, develops this capital-readiness question in detail.
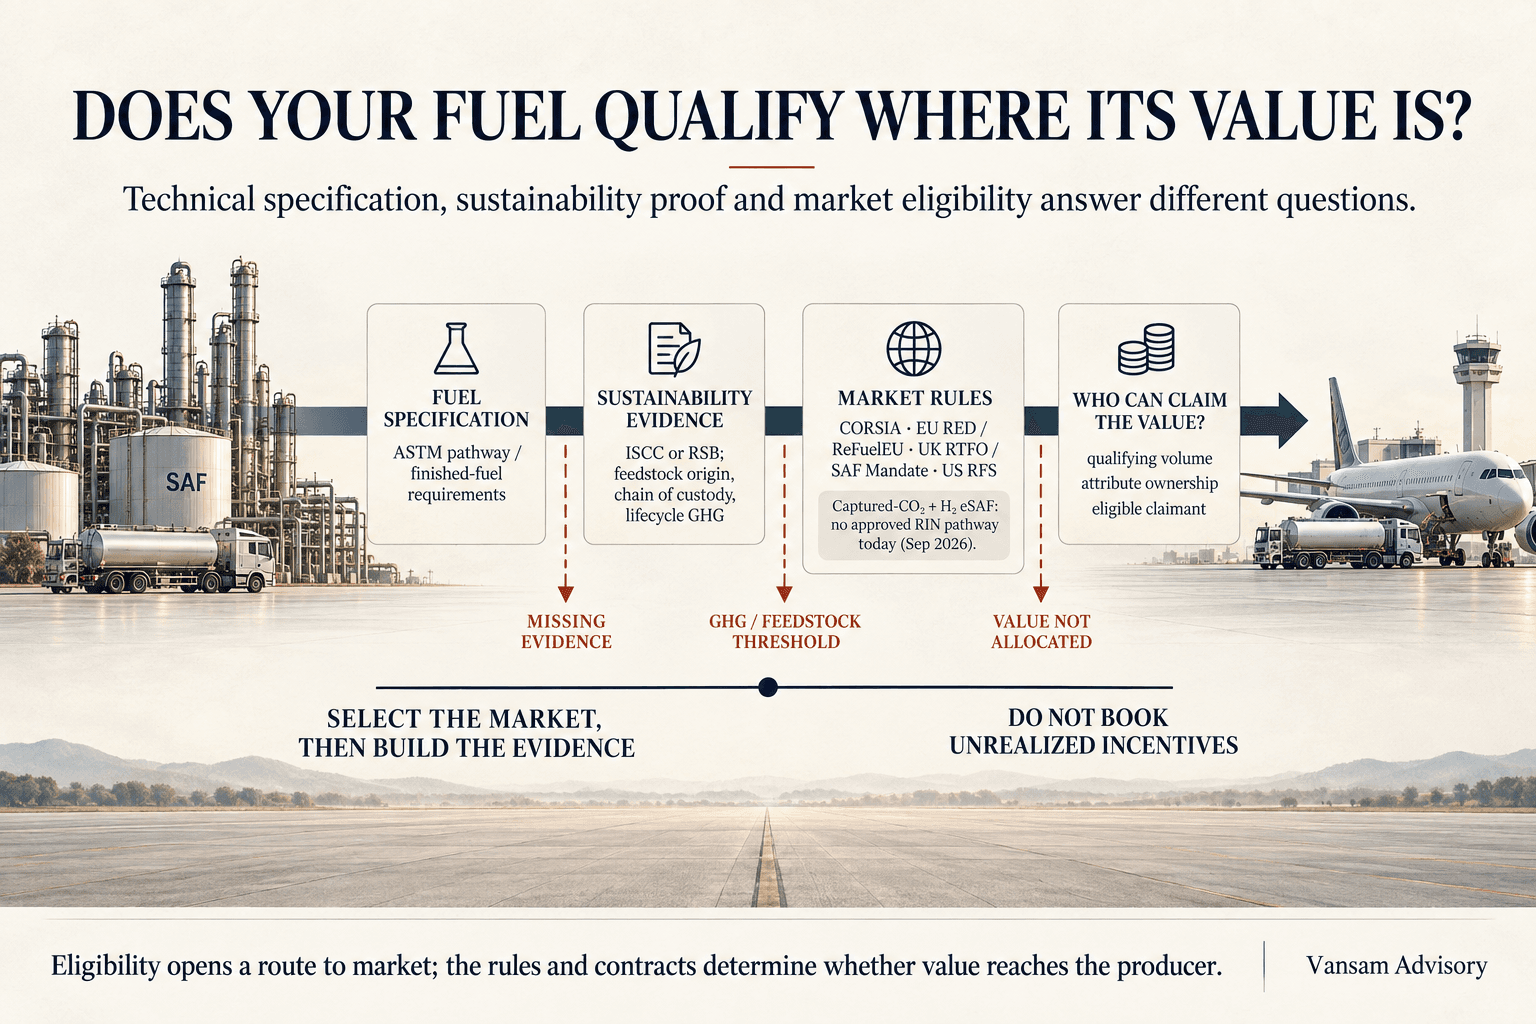
A producer can reduce a long policy checklist to four questions.
1. Can the fuel qualify?
Technical qualification and sustainability qualification should be tested together but recorded separately. ASTM D7566-26a contains eight annexes, with methanol added as an approved feedstock under the existing Annex A5 alcohol-to-jet framework rather than through a ninth annex. Each synthetic component must still be blended with conventional jet fuel and certified before entering normal airport supply.
Sustainability qualification then asks whether the feedstock, electricity, carbon source, lifecycle emissions and chain of custody satisfy the destination market. For an aviation fuel to qualify as an EU RFNBO, the renewable electricity and electrolytic hydrogen must satisfy the applicable additionality and temporal and geographic correlation rules; the carbon source and lifecycle calculation must meet the EU methodology and minimum GHG-saving threshold; and the result must remain certified and traceable through the supply chain. Technical qualification and blending under ASTM D7566 remain separate requirements. The sequence therefore runs from technical fuel qualification, to RFNBO sustainability qualification, to ReFuelEU synthetic-fuel recognition and, under the July proposal, to the narrower test for ETS allowance support.
2. Can the buyer use the value?
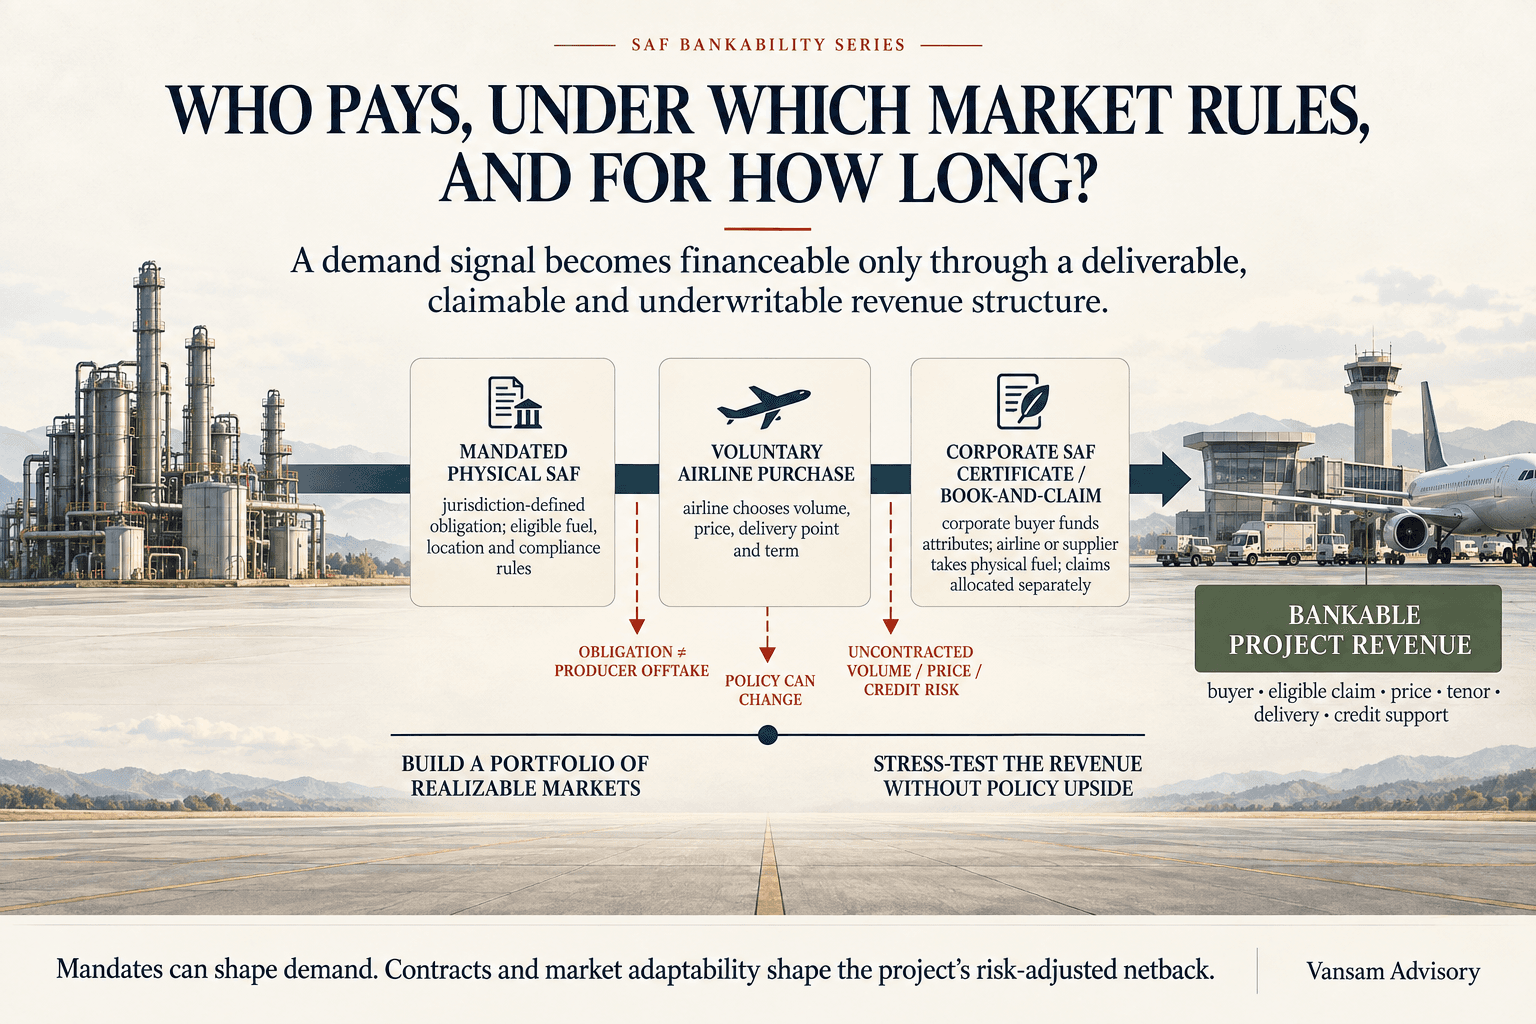
Mandated and voluntary demand should be separated. In a mandate, the environmental benefit is generally embedded in the compliance unit and cannot also be sold independently. In a voluntary transaction, physical delivery, mass balance or book-and-claim may allow the fuel and environmental attribute to be coupled differently, subject to the governing registry and duplicate-claim controls.
CORSIA provides the foundational sustainability and lifecycle framework for international aviation claims, implemented through ICAO-approved schemes including ISCC, RSB and, since October 2024, ClassNK SCS. ClassNK is a useful recent example because its Japanese identity can make it appear to be a separate national standard, while its manual expressly applies ICAO criteria, lifecycle methods, mass balance and supply-chain controls. CORSIA qualification, however, does not automatically satisfy the EU, UK, Brazil or another national compliance system. Each destination overlay remains a separate test, and a fuel with limited voluntary value under CORSIA may still carry national policy value where a domestic framework uses different feedstock rules or lifecycle assumptions. The US treatment of indirect land-use change under 45Z illustrates how one policy system can assign a different carbon value from another.
3. Which part of the revenue stack is available?
The relevant value falls into three buckets: fuel realization, market value and project support. Fuel realization is the physical price received; market value includes mandate certificates, sub-mandate premiums, buyer-side instruments such as EU ETS allowances or transferable voluntary attributes; project support includes tax credits, grants, contracts for difference and other production-side mechanisms. Each bucket has its own eligibility, duration and counterparty. A buyer-side benefit should enter a producer's revenue case only when the offtake structure determines how that value reaches the project.
4. What remains after delivery?
Projects should compare delivered value rather than plant-gate cost:
Delivered project value = fuel realization + compliance or voluntary value + production support − logistics, qualification and interface costs − policy and basis risk.
This comparison captures the real effect of transport, tariffs, blending, certification, foreign exchange, working capital and cross-border interfaces without turning the article into a list of every possible cost.
Once a project passes the four gates, developers can determine where each function creates the greatest advantage.
1. Resource geography
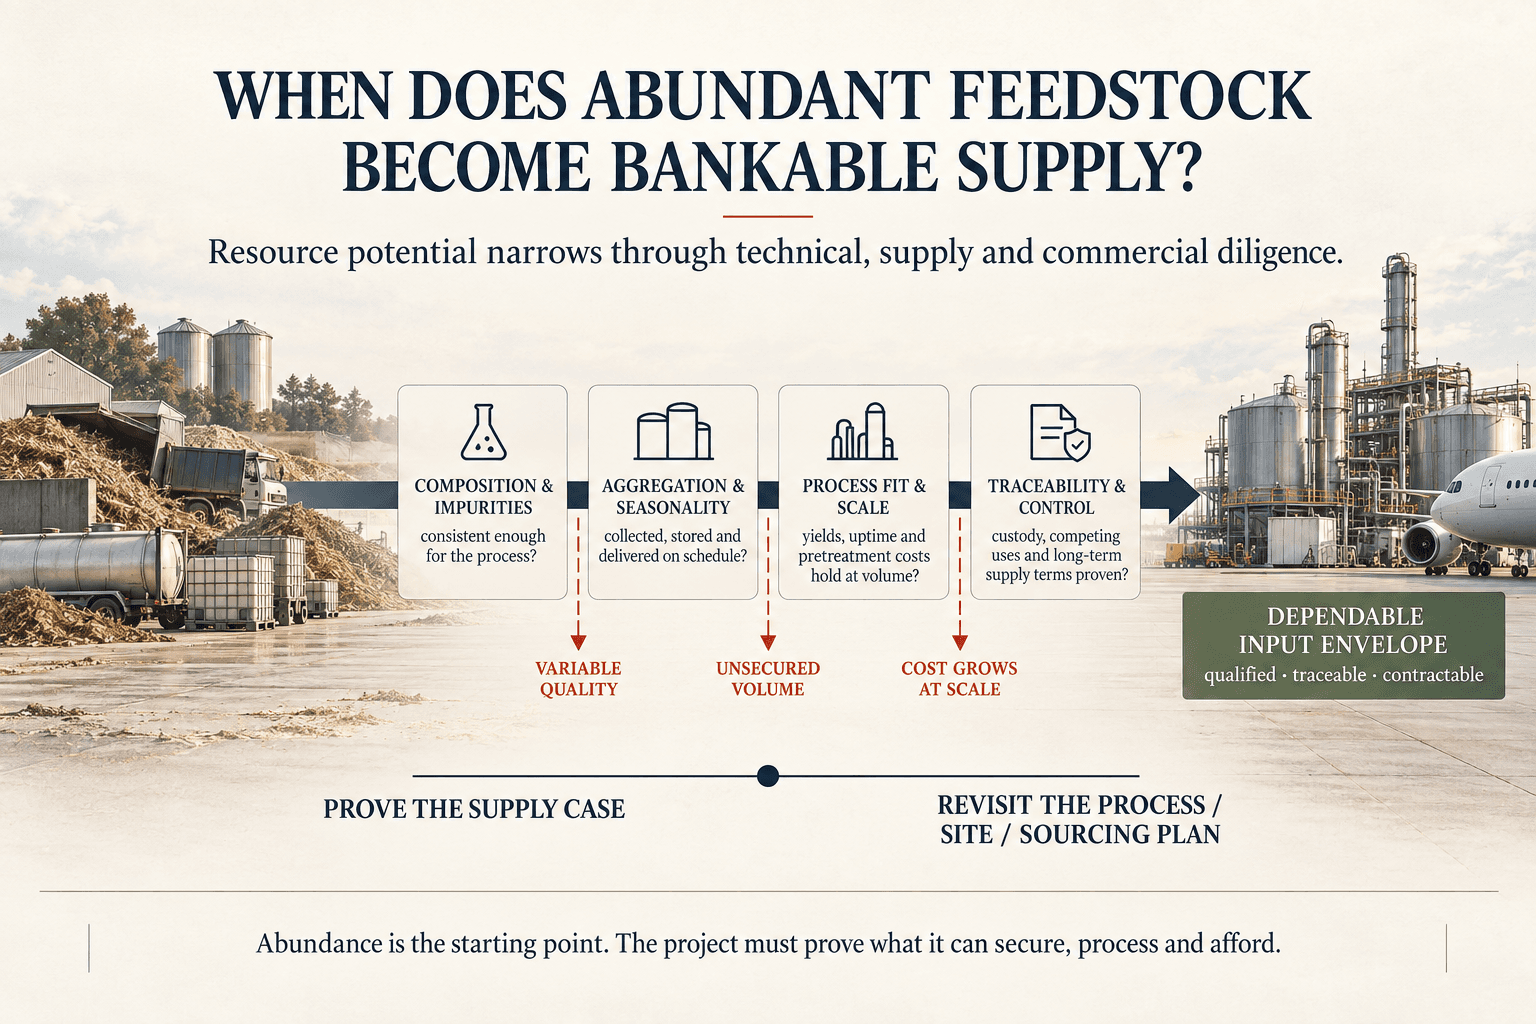
Resource geography asks where the dominant inputs are available at the required cost, carbon intensity and scale. The priority variables depend on the pathway: eligible lipids for HEFA; low-carbon alcohol for ATJ; consistent biomass or waste for FT; and qualifying electricity, hydrogen and carbon dioxide for PtL. Trade restrictions and provenance controls belong in this analysis because they determine whether a low-cost input can lawfully and credibly reach the project.
2. Intermediate-production geography
Intermediate geography asks whether value is best created by moving the raw resource, a stable intermediate or the finished fuel. Ethanol and methanol can travel through established commodity systems; syngas generally cannot; renewable crude and FT liquids require pathway-specific assessment. The decision turns on three priorities: transport economics, preservation of lifecycle performance and continuity of sustainability evidence.
3. Final-conversion and integration geography
Final conversion extends beyond the upgrading reactor. It includes access to hydrogen and utilities, blending stock, storage for the neat synthetic component, laboratory testing, certification, custody transfer and connection to terminals, pipelines or airports. These capabilities determine whether a producer can offer an airline usable fuel rather than a component that still requires another party to solve the final integration problem.
Singapore, the US Gulf Coast and established European refining and port clusters illustrate the value of fuel-handling infrastructure. The optimal location may therefore be the site that combines competitive conversion with an efficient route through blending and distribution, even when the upstream intermediate is produced elsewhere.
4. Market geography
Market comparison can be kept to three decisions:
- Access: Does the product qualify, and can it reach the obligated or voluntary buyer in the required period?
- Value: What fuel, compliance, voluntary and production-support revenues are available, and for how long?
- Delivery: What logistics, blending, tariff, tax and counterparty costs must be carried to realize that value?
These three buckets preserve the necessary analysis without allowing the market screen to become a catalogue of policy features.
Where policy value accrues first to the buyer, as proposed for expanded EU ETS aviation allowances, the value test should also identify the claiming party and the contractual route by which the project participates. This prevents a producer from treating an airline benefit as project revenue before the offtake terms make it one.
5. Attribute geography
Attribute geography asks who may claim the emissions reduction, under which system and at what point in the chain. For mandated demand, the attribute normally travels into the compliance mechanism; for voluntary demand, physical delivery, mass balance and book-and-claim can create different routes to Scope 1 or Scope 3 value.
Cross-border recognition is not automatic. A certificate or lifecycle result accepted where an intermediate is produced does not establish qualification in the conversion or destination market. Before separating production, the developer needs a documented route showing how feedstock origin, electricity, carbon source, mass balance, custody and claim ownership will be accepted at every boundary. Until that route is clear, the geographic cost advantage belongs in an option case rather than base revenue.
The value of every geography changes over time, although the changing variables can be organized into three clocks.
- The project clock covers technology scale-up, engineering, qualification, commissioning and debt tenor.
- The policy clock covers mandate step-ups, sub-mandate changes, incentive expirations, scheduled reviews and evolving eligibility rules.
- The market clock covers feedstock, electricity, carbon, freight, foreign exchange and competing demand.
The configuration should work when financing closes, when the plant commissions and through its core repayment period. A project that depends on 45Z after its current 2029 expiry, on a future mandate level still subject to review, on a proposed buyer-side allowance whose value has not been incorporated into an offtake, or on renewable electricity remaining available at an early-stage price needs an explicit bridge between the assumption and the contracted cash flow.
For PtL projects serving the EU, temporal correlation moves from monthly matching through 2029 to hourly matching from 2030. That shift can change electrolyser utilization, storage requirements and delivered cost, so the operating case should reflect the rule that applies after commissioning rather than the one in force during development.
- HEFA economics are led by lipid cost and eligibility. Waste lipids remain central, while seed oils may qualify or face limits depending on the destination framework and their lifecycle treatment. The commercial priority is to secure a feedstock portfolio that preserves market access, then determine whether pretreatment should occur near the resource and upgrading near existing hydrogen, refining and blending infrastructure. Competition with renewable diesel must be included because both products draw from the same lipid pool.
- ATJ economics are led by alcohol cost, alcohol carbon intensity and conversion performance. Second-generation alcohols can improve sustainability positioning, while their cost and availability may constrain scale; first-generation ethanol can offer established supply and attractive economics, while lifecycle emissions and feedstock rules determine market value. Brazil's sugarcane and expanding corn-ethanol base creates a strong production option, while current US-Brazil trade measures reinforce the need to compare ethanol movement with conversion at origin. The decision is not simply where ethanol is cheapest; it is where an eligible tonne of finished SAF delivers the highest value.
- FT economics concentrate in feedstock aggregation, preprocessing, gasification, syngas quality, capital cost and uptime. Gasification and synthesis usually require close integration because syngas is not a practical traded intermediate, while an FT liquid may allow upgrading elsewhere. The configuration should therefore preserve the front-end integration required for reliable operation and test whether moving a stable liquid creates enough downstream advantage to justify another interface.
- Power-to-liquid (PtL) and eSAF economics are led by qualifying electricity, electrolytic hydrogen and plant utilization; carbon-source eligibility and the ability to maintain RFNBO compliance over time are equally important to market access. The addition of methanol under ASTM D7566 Annex A5 creates a commercially relevant architecture because renewable methanol can be produced near competitive power and moved to a conversion and distribution hub.
ETFuels provides a useful current example. Its Rattlesnake Gap project in West Texas is in FEED and designed to produce 120,000 tonnes of e-methanol annually; in July 2026, ETFuels selected Immingham for Project Kings Road Humber, a methanol-to-jet refinery intended to use Texas feedstock and the Humber's storage, port and fuel-distribution infrastructure. The model demonstrates geographic disaggregation, while the investment case still depends on synchronized engineering, qualification, feedstock specification, destination-market recognition and commissioning schedules at both ends of the chain.
Germany provides the complementary lesson as German law recently established penalties of €4,700 per tonne for a general SAF shortfall and €17,000 per tonne for a synthetic-fuel shortfall once that obligation begins, giving the ReFuelEU requirements financial weight. Later that month, Sasol and Topsoe announced that they would wind down Zaffra, their SAF joint venture, while retaining their technology-licensing collaboration through the Single Point Licensor framework. The policy signal and the commercial restructuring can be read together without treating them as directly connected: mandates establish demand and a shortfall cost, while each venture and project must still align technology, power, carbon, contracts and capital on financeable terms. That distinction remains important ahead of the scheduled 2027 ReFuelEU review.
Geographic separation creates value only when the interfaces remain manageable. Each proposed boundary can be tested through three questions.
- Physical performance: Does separation preserve yield, product stability, specification control and reliable operations, and is the intermediate practical to store and transport?
- Qualification and custody: Can sustainability evidence, lifecycle data and environmental attributes pass cleanly across the boundary, and are blending, testing and off-specification responsibilities clear?
- Commercial and financial allocation: Are the interface guarantees, contract tenors, currencies, completion dates and change-in-law provisions strong enough for investors and lenders to underwrite the combined chain?
This structure brings technical, policy and bankability risks into the same decision without treating them as one undifferentiated checklist. For a multi-jurisdiction project, the financing question becomes particularly practical. If the upstream plant and downstream converter sit in separate project companies, lenders need enforceable security and step-in rights at both; each facility needs a credible remedy if the other starts late or underperforms; feedstock, intermediate sale, conversion and final offtake contracts need compatible volumes and tenors; and the revenue-support period needs to align with the debt case. The lowest modeled cost is useful, although the financeable configuration is the one that converts that advantage into durable cash flow.
The framework can be applied without attempting to solve every market at once. Before the next venture round, engineering gate or FID, a development team should be able to answer three questions.
- Which markets can the project credibly access, and where does the fuel clear? Separate technical qualification, sustainability eligibility, compliance recognition and voluntary use, then identify the buyer, durable price and available support.
- Which configuration creates the strongest delivered value? Identify the two or three variables that drive cost and carbon intensity, then compare resource, intermediate, conversion and integration locations after logistics, qualification and interface costs.
- What must be resolved before the next capital commitment? Align technology evidence, D4054 planning where required, blending, custody, cross-border recognition, contracts and engineering maturity, while funding additional market optionality only where its expected value exceeds its cost.
For a novel technology company, the next round should fund the evidence needed to preserve a credible market route. For an established-pathway developer, the framework should shape the basis of design, FEED scope, offtake strategy and FID case before local assumptions harden into project architecture. Investors and lenders should distinguish revenue that can be contracted and recognized from policy value that remains conditional, while offtakers should test whether the producer can deliver qualifying, blended fuel with the required custody and attributes rather than leaving those interfaces to be solved after contracting.
The widening SAF demand map gives developers more routes to market and greater freedom to design around resources, production capabilities and customer value. That flexibility becomes commercially useful when eligibility, integration and financing are resolved alongside the technology.
The strategic question is therefore broader than where to build the plant. It is which configuration gives the project the strongest credible route to valuable markets, and what must be proven at the next development gate to keep that route open.
Which part of your project architecture is still based on a local-market assumption that may no longer hold?
Vansam Advisory helps SAF and feedstock platforms build cost-competitive, customer-ready and financeable projects. We work with producers, developers and capital providers to connect policy, pathway economics, market eligibility and geographic alternatives to project architecture and commercial decisions.
Explore the companion insight:The Least-Mature Evidence Sets the Pace, which examines how product, project and market evidence must mature together before the next capital decision.
Discuss a project:Contact Vansam Advisory
hello@vansamadvisory.com